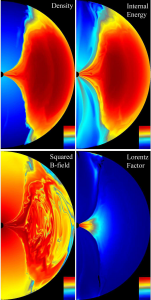
Panels from final timestep t = 8000 M (1.4×10⁵ s) of HARM data, as labelled for different physical quantities. We show a cut-out in the r-z plane, with the black hole’s horizon shown on left. As detailed in the text, the radial direction is scaled logarithmically, and angular dimension is scaled more finely toward the equator. Therefore, the finest resolution is obtained closest to the horizon and equator. This causes a “spreading” effect in the images, as they are shown evenly spaced by cell number, not physical value. Each quantity is shown on a logarithmic scale, with dark red being the highest values, black being the lowest.A selection of movies demonstrating the advanced numerical modeling and visualization capabilities of the Solar Physics Group. The movies show the predicted evolution of an active region core subject to a large number of small-scale heating events (nanoflares), as it would be observed by the SDO/AIA 94, 131, 171, 193, 211, and 335 Å channels. There are 400 magnetic field lines comprising the active region core, which was subject to a total of 4000 nanoflares with energies drawn from a power-law distribution between 10^23 – 10^25 erg and a spectral index of -2.5. The delay between nanoflares re-energizing plasma along a field line was chosen to be proportional to the energy of the next event. These movies represent ‘synthetic’ observations and they can be analyzed using exactly the same tools and techniques as the real observations provided by our fleet of space-based instrumentation. This allows direct comparisons to be made between model results and observational data, and provides extremely strong constraints on the physics of coronal loops and on the properties of potential coronal heating mechanisms. Figure courtesy of Edison Liang.


